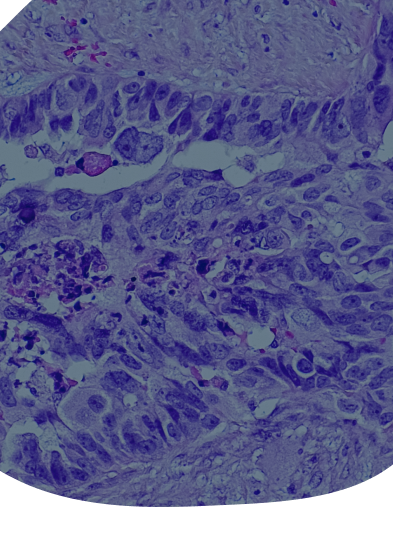
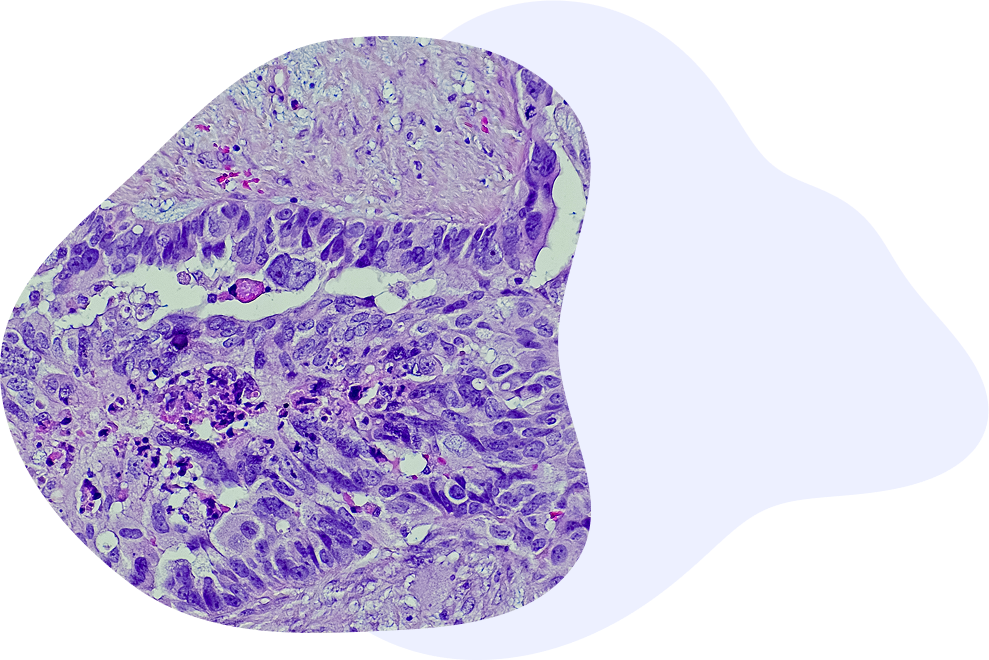
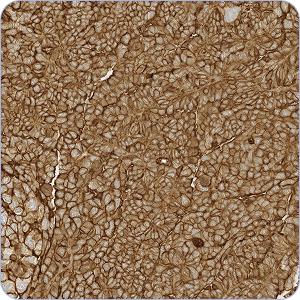
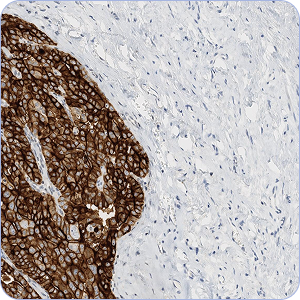
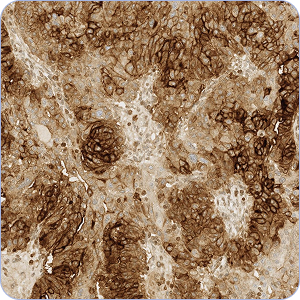
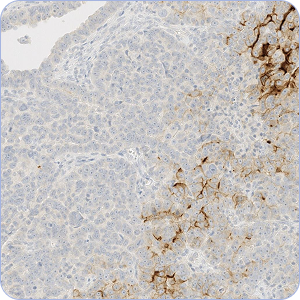
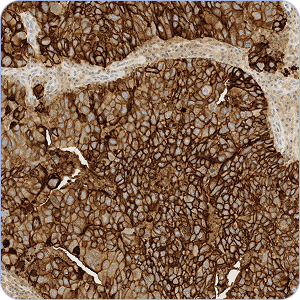
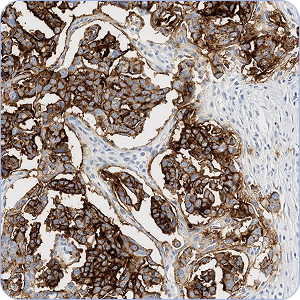
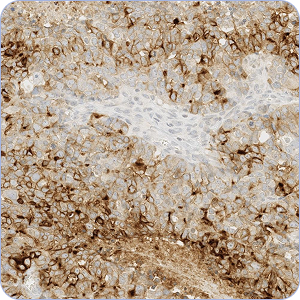
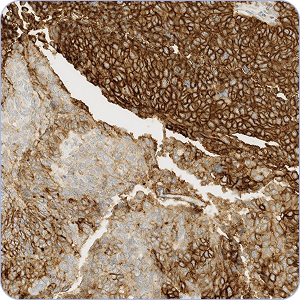
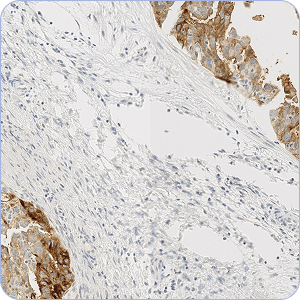
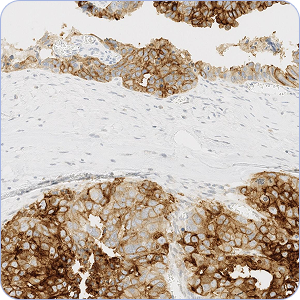
Review a collection of ovarian cancer cases and learn about FRα assessment in tissue samples

FRα is a biomarker in ovarian cancer and can be detected via IHC analysis.1-3​

FRα is a biomarker in ovarian cancer and can be detected via IHC analysis.1-3​

CLASSIFICATION
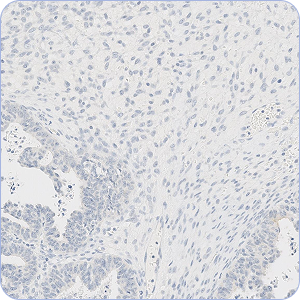
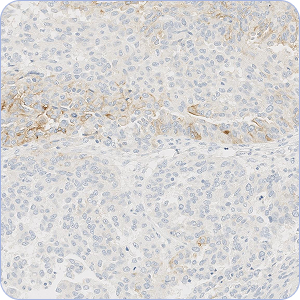
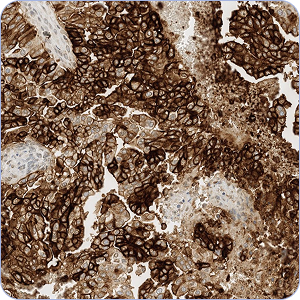
FR alpha (FRα) expression is assessed by IHC and can be classified as​:1
Negative
Absence of any detectable signal; may exhibit pale gray cytoplasmic and/or membranous discoloration.
Weak
Faint gold/light brown hue that may be partial or circumferential.
Moderate or strong
Chocolate brown to thickened dark brown, black hue that may be partial or circumferential.
Negative
Absence of any detectable signal; may exhibit pale gray cytoplasmic and/or membranous discoloration.
Weak
Faint gold/light brown hue that may be partial or circumferential.
Moderate or strong
Chocolate brown to thickened dark brown, black hue that may be partial or circumferential.
Classification may be based on membrane localization only. The relative percentages of tumor cells (TCs) stained at each intensity are visually estimated and used to generate an assessment.1*
Tissue Requirements1
FFPE epithelial ovarian cancer tissue
~4 μm sections with minimum of 100 viable tumor cells
Testing1
~4 serial tissue sections are used from each case:
H&E
to visualize cellular morphology
Negative control
to determine levels of non-specific background staining
Anti-FRα antibody
to detect FRα expression
Positive control
to serve as a quality control during IHC testing
*Results should be interpreted by a qualified pathologist in conjunction with histological examination, relevant clinical information, and proper controls.
FFPE=formalin-fixed paraffin-embedded; FRα=folate receptor alpha; H&E=hematoxylin and eosin; IHC=immunohistochemistry.
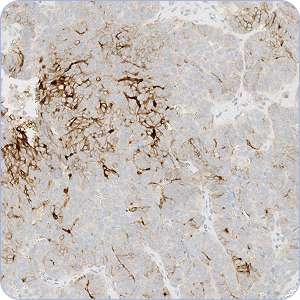
FRα staining intensity can be classified as strong (3+), moderate (2+), weak (1+), or negative (0) based on membrane localization.1
  • ​The relative percentages of TCs stained at each intensity are visually estimated
  • Viewing a case at multiple levels of magnification may be helpful in estimating relative TC percentages

TO VIEW WHOLE-SLIDE IMAGES AND MORE MAGNIFICATION LEVELS FOR EACH CASE, TAP THE LINKS BELOW4
This tool has been developed by AbbVie and is for demonstration purposes only. Assessments of website images were conducted by a consensus of 3 pathologists. Images are representative and for illustrative purposes only and not intended for clinical use.
FRα=folate receptor alpha; TC=tumor cell; WSI=whole-slide image.
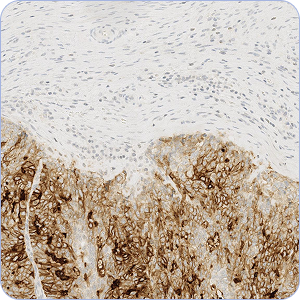
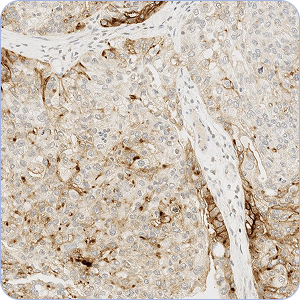
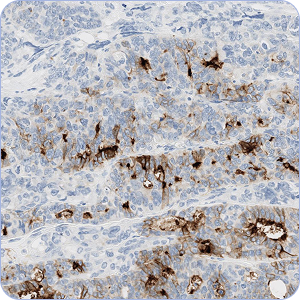
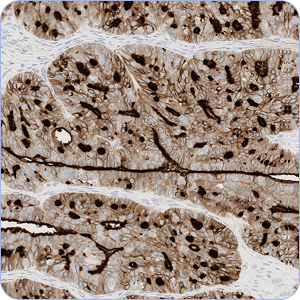
FRα IHC staining in ovarian cancer can display unique staining patterns, which are described below. As with any IHC, non-specific background and artifacts may also be present.1
TAP TO REVIEW
TO VIEW WHOLE-SLIDE IMAGES AND MORE MAGNIFICATION LEVELS FOR EACH CASE, TAP THE LINKS BELOW4
This tool has been developed by AbbVie and is for demonstration purposes only. Assessments of website images were conducted by a consensus of 3 pathologists. Images are representative and for illustrative purposes only and not intended for clinical use.
FRα=folate receptor alpha; IHC=immunohistochemistry; TC=tumor cell; WSI=whole-slide image.
Relevant Resources
TAP TO DOWNLOAD PDF REFERENCES ON FRα IHC ASSESSMENT AND CHALLENGING STAINING PATTERNS
References
  1. VENTANA FOLR1 (FOLR1-2.1) RxDx Assay Interpretation Guide for Epithelial Ovarian, Fallopian Tube, or Primary Peritoneal Cancer. 1015089US Rev B. 2023-09-01.
  2. List of cleared or approved companion diagnostic devices. US Food and Drug Administration. Updated March 5, 2025. Accessed March 25, 2025. www.fda.gov/medicaldevices/in-vitro-diagnostics/list-cleared-or-approved-companion-diagnostic-devices-in-vitro-and-imaging-tools.
  1. AFOLR - Overview: Folate receptor alpha (FOLR1), semi-quantitative immunohistochemistry, manual. Mayo Clinic Laboratories. Accessed March 25, 2025. www.mayocliniclabs.com/test-catalog/overview/620731.
  2. Images are provided by Roche Diagnostics.
DISCLAIMER
This tool has been developed by AbbVie and is for demonstration purposes only. Assessments of website images were conducted by a consensus of 3 pathologists. Images are representative and for illustrative purposes only and not intended for clinical use.
See More
See Less
Leaving AbbVie Website

You are leaving the AbbVie website and connecting to a site not under the control of AbbVie. AbbVie is not responsible for the contents of any such site or any further links from such site. AbbVie is providing these links to you only as a convenience and the inclusion of any link does not imply endorsement of the linked site by AbbVie. You should also be aware that the linked site may be governed by its own set of terms and conditions and privacy policy for which AbbVie has no responsibility.

Conversely, the presence of this link does not imply the linked site's endorsement of Explore FR alpha or AbbVie.

Do you wish to leave this site?

No, back to Explore FR alpha
Challenging FRα Staining Patterns1
Heterogeneous FRα Expression
Obscuring Cytoplasmic Staining
Dot-like Staining Pattern
Apical Staining Pattern
Non-specific Background Staining
Tissue or Staining Artifacts
Characterization
Variable membrane staining intensity
Staining in the cytoplasm of TCs
Cases exhibiting dark brown secretions filling the gland lumens, mimicking membrane staining
Staining in tissues with glandular or tubular morphology
Staining not associated with FRα expression
Can include: fixation gradients and edge effects, DAB trapping, nuclear bubbling, lack of staining in regions, tearing or folding of tissue, loss of tissue section
Assessment Impact
May require closer examination at both higher and lower power to determine TC percentages

Challenging to determine membrane specific staining. Viewing the slide at a higher magnification may help elucidate staining patterns
Assessment for dot-like staining may be required for accurate interpretation. If present, dot-like staining of gland lumens is included in the FRα assessment. Dots observed in the cytoplasm are not included in assessment
If present, assessment of concurrent membranous staining in the portion of cells oriented toward the lumen of a gland or tubule is required
Evaluation of internal control areas and positive/negative control slides should be used to assess the level of non-specific background staining
Repeat staining or new sample may be required
DAB=3,3'-diaminobenzidine; FRα=folate receptor alpha; TC=tumor cell.
Characterization
Assessment Impact
Heterogeneous FRα Expression
Variable membrane staining intensity
May require closer examination at both higher and lower power to determine TC percentages
Obscuring Cytoplasmic Staining
Staining in the cytoplasm of TCs
Challenging to determine membrane specific staining. Viewing the slide at a higher magnification may help elucidate staining patterns
Dot-like Staining Pattern
Cases exhibiting dark brown secretions filling the gland lumens, mimicking membrane staining
Assessment for dot-like staining may be required for accurate interpretation. If present, dot-like staining of gland lumens is included in the FRα assessment. Dots observed in the cytoplasm are not included in assessment
Apical Staining Pattern
Staining in tissues with glandular or tubular morphology
If present, assessment of concurrent membranous staining in the portion of cells oriented toward the lumen of a gland or tubule is required
Non-specific Background Staining
Staining not associated with FRα expression
Evaluation of internal control areas and positive/negative control slides should be used to assess the level of non-specific background staining
Tissue or Staining Artifacts
Can include: fixation gradients and edge effects, DAB trapping, nuclear bubbling, lack of staining in regions, tearing or folding of tissue, loss of tissue section
Repeat staining or new sample may be required
DAB=3,3'-diaminobenzidine; FRα=folate receptor alpha; TC=tumor cell.